Learn how to build a weekly safety dashboard from systems you already have, then layer AI video analytics on existing CCTV to quantify PPE and proximity risks by shift and zone. The article covers schema design, data contracts, quality checks, a practical pilot plan, and how to link improvements to reduced claims, downtime and penalties. Templates for ISO 45001 or OSHA exports and vendor validation steps are included.

A practical guide to factory safety dashboards, leading indicators, and AI video analytics you can deploy on existing CCTV
If you want to know how to get analytics on safety compliance trends in factories, start by turning the safety data you already collect into clear trend lines that supervisors and executives can act on. Bring incidents, near misses, observations, training status, maintenance logs and camera detections into a single view, then track adherence by shift, line and zone each week. Layer in AI video analytics on your existing cameras where it strengthens those leading indicators, and keep governance simple with clear definitions, role-based access and routine exports so audits stay straightforward. If you want a quick look at how this works in practice, check out Invigilo for manufacturing safety analytics. Any specifics that depend on your environment or plan should be confirmed directly with Invigilo.
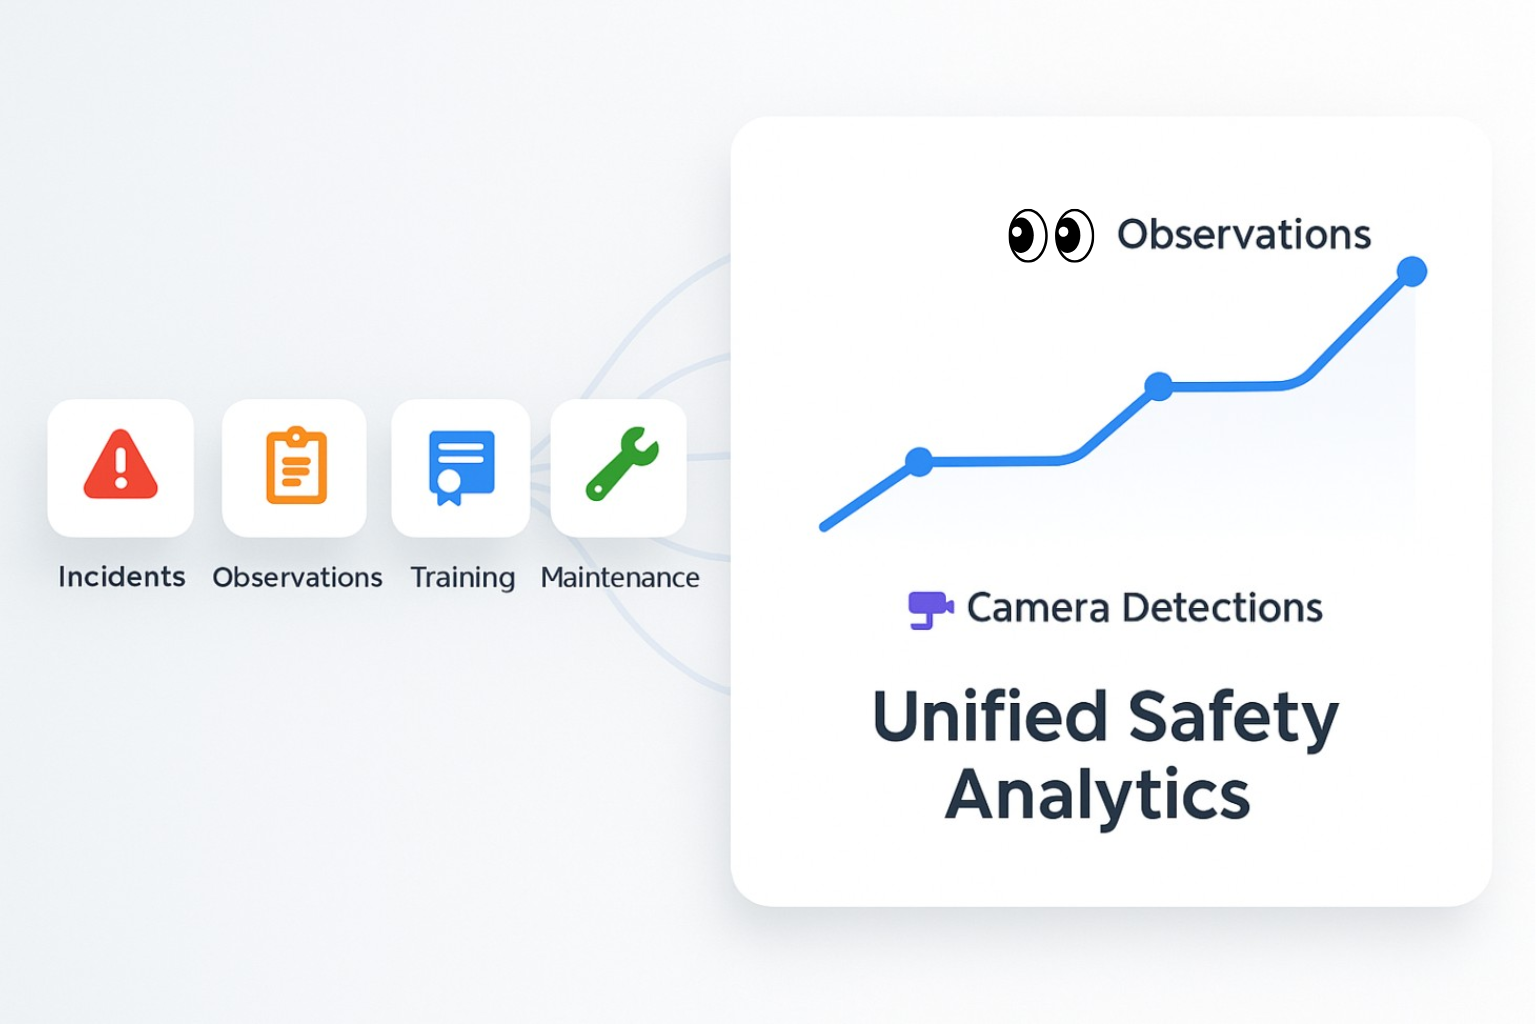
Trend analytics is the practice of converting day-to-day safety signals into time-series insights that show whether your controls are holding. In a factory, these signals include lagging records such as incidents and near misses, operational checks such as pre-start observations, competence signals such as training currency, and machine-adjacent telemetry such as e-stops or access control entries. With a safety analytics platform, camera detections for PPE adherence, work-at-height exposure, and unsafe proximity to machinery become additional leading indicators. When each stream is time-stamped and mapped to a common set of dimensions, you can spot drift early, act quickly, and assemble audit packs without a last-minute scramble. For a quick primer on how this looks in practice, see Invigilo’s AI video analytics for manufacturing safety page.
The mechanics are straightforward.
First, ingest each source into a clean table with mandatory keys for time, location, line, zone, shift, and, where appropriate, a person or contractor identifier.
Second, normalise names and codes across sites so “Assembly Line B” in one plant matches “Line-2” in another.
Third, aggregate daily and weekly views with consistent formulas and control limits, so up-and-down movement is visible without noise.
Finally, export a monthly evidence pack with trend plots, a sample of underlying records, and your CAPA status. If you need mandated templates, contact Invigilo.
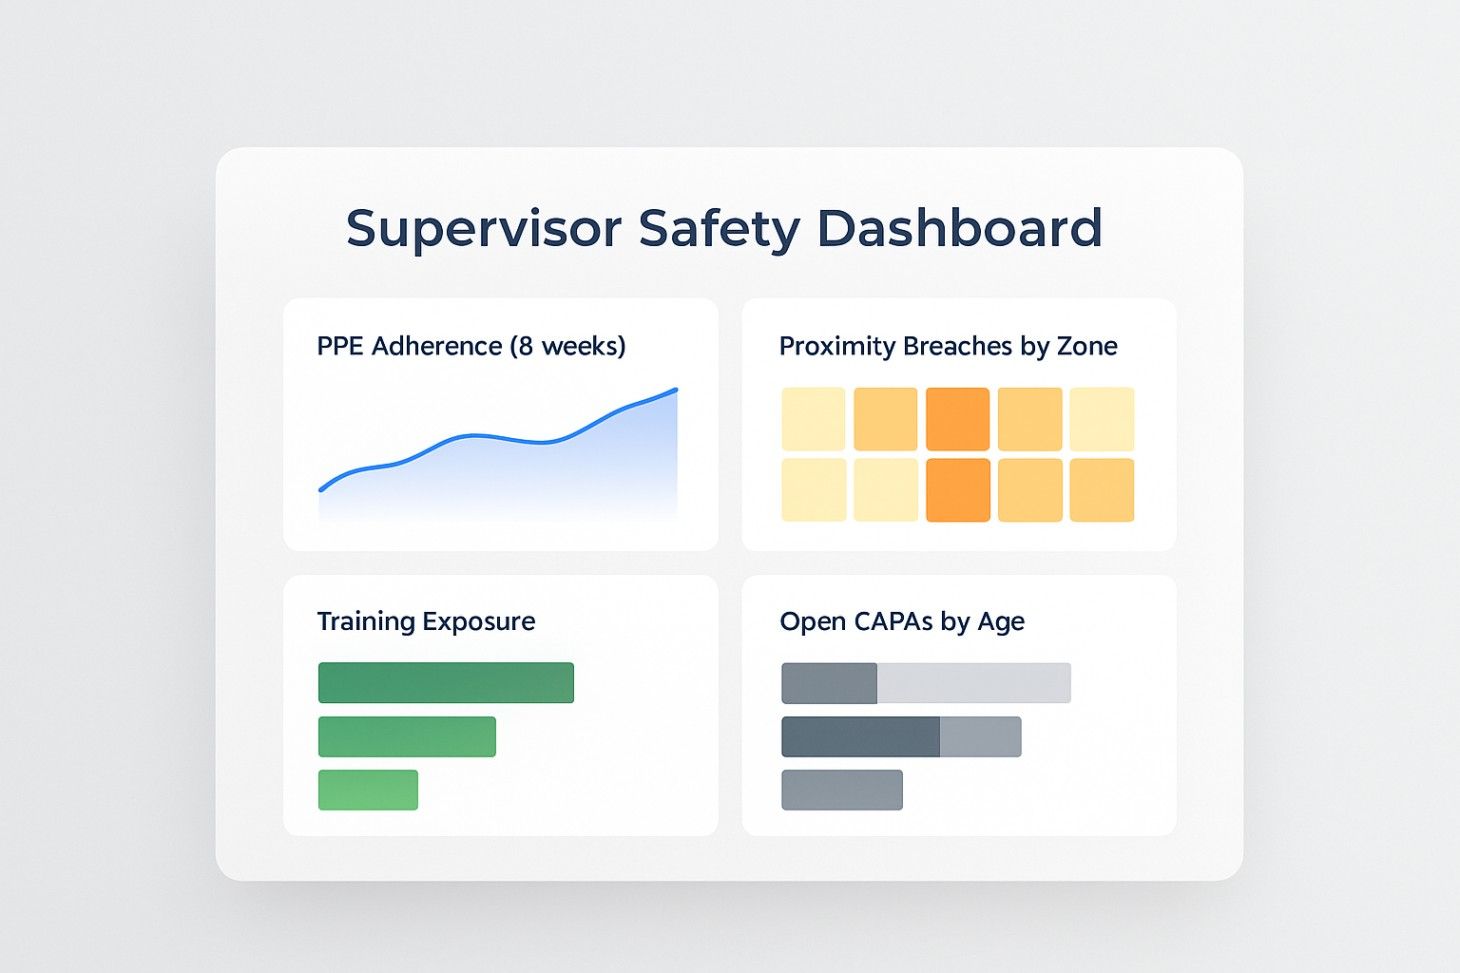
Supervisors need a short weekly page that highlights where drift is happening and which actions are overdue. HSE managers need to see momentum in leading indicators and the ageing pattern of corrective actions. Executives care about risk direction across sites, audit readiness, and the line of sight to reduced claims, downtime, and penalties. The same underlying data can serve all three, as long as each view is tailored.
You can begin with five tables: Incidents, Near-misses, Observations, Training status, and Camera detections in the areas you care about most. Define each metric with an explicit numerator, denominator, time window, and required dimensions. If you want a metric dictionary aligned to your setup, contact Invigilo.
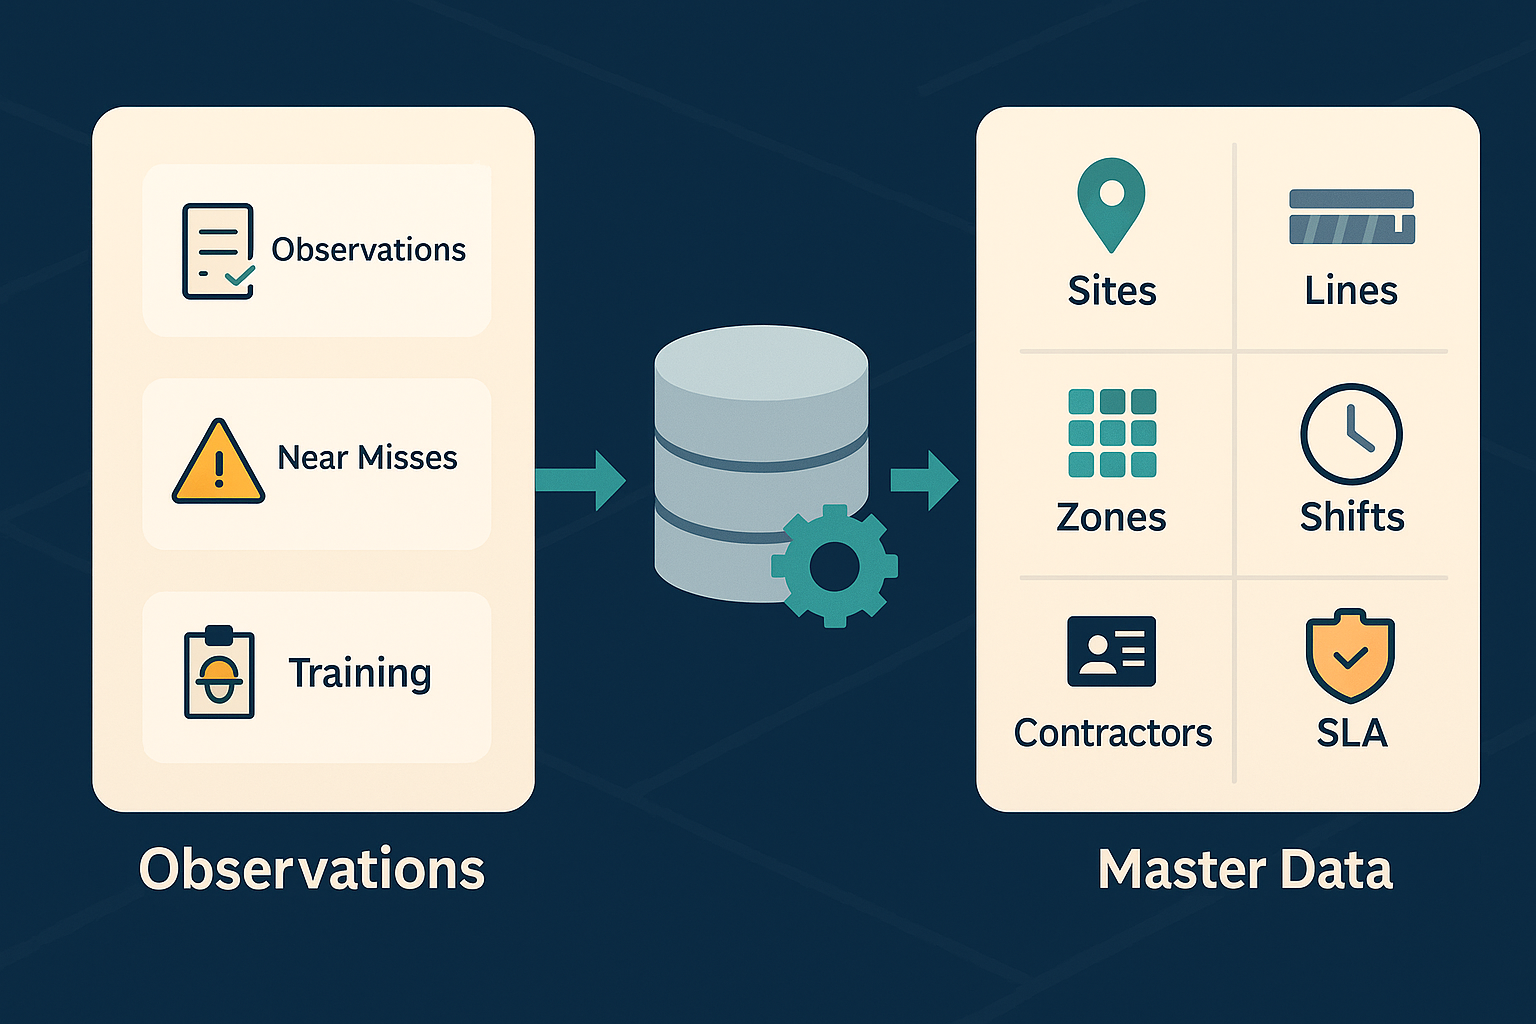
Start by centralising what you already collect. Unifying pre-start observations and near-misses typically delivers immediate insight because completion pressure and inconsistent recording often mask real exposure. Add training currency, and you will see where expired modules cluster by shift and contractor. With just these sources, you can produce credible weekly reports while you prepare camera and equipment integrations.
Normalisation is the next hurdle. Create small master data tables for sites, lines, zones, shifts, and contractors. Map each record to those keys at ingestion. Where plants use different zone names or shift boundaries, standardise them into a reference taxonomy so multi-site comparisons remain fair.
Data contracts keep charts trustworthy. Require ISO-8601 timestamps, mandatory keys, accepted ranges, and a simple daily delivery service level. Reject or quarantine records that break the contract rather than allowing them to pollute your trend lines.
A star schema works well. Keep a fact table for each signal type and a shared set of dimensions.
For example, CameraDetections holds one row per detection with time, zone, shift, PPE class or proximity type, and confidence. You can then roll this up to hourly and shift bins for trend charts. Observations and NearMisses should carry hazard categories and links to CAPA records so root-cause and closure analytics are straightforward. Machine-adjacent signals, such as e-stops and forklift telemetry, often correlate with exposure. Even if they are not safety systems, they add useful context when contrasted with breaches and non-compliance. For a simple walkthrough of how raw footage becomes trend data, see Invigilo’s turn footage into time-series trends article.
Data quality checks should run daily. Count records by source and zone, test for missing keys, look for time gaps, and flag out-of-range values. If your platform includes quality dashboards, use them. If not, implement light rules in your ETL so bad records are quarantined rather than polluting charts. If you want platform-specific validators or recommended thresholds, contact Invigilo.
Lagging indicators, such as incident frequency rate, remain necessary for reporting, but they rarely change in time to prevent the next event. The practical shift is to make leading indicators measurable and auditable, so they drive weekly action.
A balanced set for factories commonly includes:
Numerator: compliant detections. Denominator: total detections within the same shift and zone. Dimensions: site, line, zone, shift, role.
Numerator: summed duration of proximity breaches. Denominator: operator hours in the same period, scaled by 100. Segment by equipment state where possible.
Numerator: completed checks. Denominator: planned checks for the shift. Segment by work area to find weak routines.
Numerator: hours worked by people with expired modules. Denominator: total hours for the same shift or contractor.
Median days from open to close, segmented by root cause and zone.
Set thresholds using your baseline plus a sensible tolerance band, and treat two consecutive breaches as a trigger for a short, structured review. This keeps attention on small drifts before they become incidents and gives you evidence that the programme is responsive.
For a broader context on how these measures fit into a modern factory stack, see Invigilo’s manufacturing safety with AI overview.
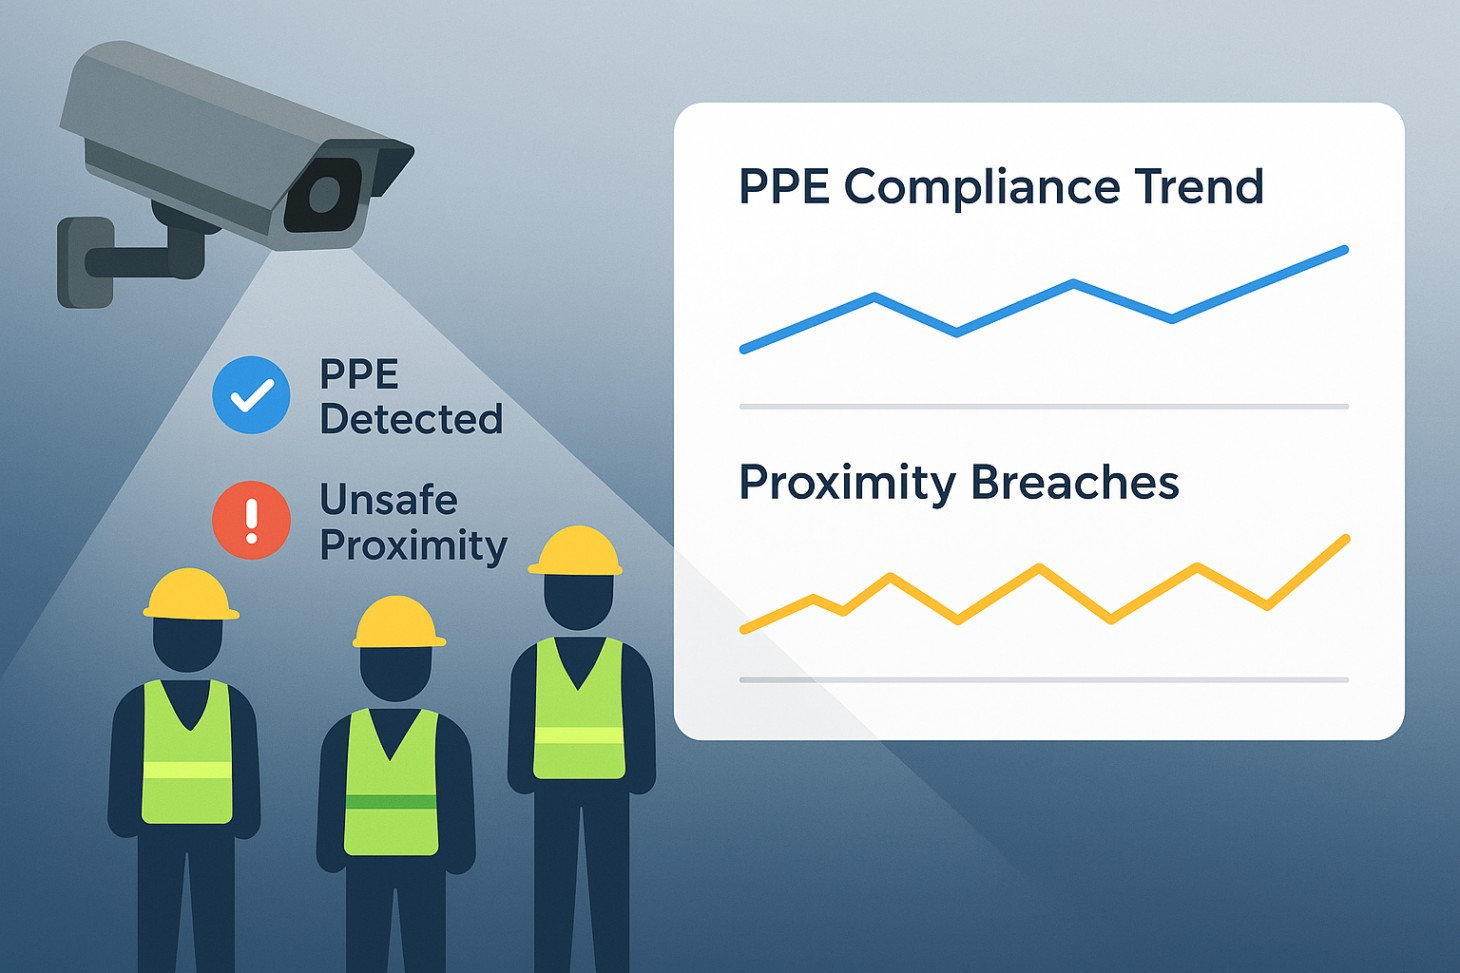
Camera detections are most useful when they are treated as counts and durations rather than one-off alerts. In a factory, the high-value classes are PPE adherence in designated zones, unsafe proximity to energised machinery or vehicles, and work-at-height exposure. When each detection is logged with time, zone, and shift, those events roll up into weekly trend lines that show whether your controls are working. For a short primer on proximity in plant settings, see Invigilo’s guide on unsafe proximity to machinery in factories.
Noise control is the difference between a system the team relies on and one they mute. Use three simple levers: set a minimum confidence score below which detections are ignored, apply a minimum dwell time so brief occlusions do not fire, and add a short cool-down per zone to prevent duplicates when several frames capture the same behaviour. This combination reduces false positives without blinding the team. If you need configurable suppression windows or escalation rules that change by shift, contact Invigilo to confirm what is available on your plan.
Crucially, analytics should not stop at counting. Aggregate breaches by zone and time of day to spot patterns and link them to practical changes. If proximity spikes at shift change, consider adjusting walkways or marshalling points. If PPE non-compliance clusters on a contractor’s night shift, run a targeted toolbox talk and a simple kit check at the start of that shift. For examples of how teams convert detections into action, browse Invigilo’s case studies and best practices for manufacturing.
A focused pilot answers three questions: is the data correct, are the alerts useful, and do the resulting actions bend the trend line down?
Wire up data feeds and confirm time alignment and zone maps. Choose two leading indicators that matter to the line you pick, for example, PPE adherence and proximity minutes per 100 operator hours.
Run shadow alerts on recorded footage. Check precision, recall, and time to alert. Adjust confidence, dwell, and cool-down until the false-positive rate is tolerable.
Route alerts to supervisors on WhatsApp, Microsoft Teams, or SMS. Measure response time and close the loop on actions taken.
Implement one control change based on the data. In the review, show the slope change in the affected indicator.
A short pilot report with before-after charts, alert quality metrics, and a description of the control change is often enough to secure scale-up funding. For roll-out patterns other plants have used, link to Invigilo’s Case Studies and Best Practices.
Finance teams are rightly sceptical of hand-waving. Anchor your benefits to the line items most likely to move first: lost-time claims, unplanned downtime, overtime to catch up after stoppages, scrap linked to safety-driven interruptions, insurance modifiers, and contractor penalties. Use a simple counterfactual. Pick a matched line that did not receive alerts and compare slopes using a rolling four-week window. Annotate interventions directly on your charts so the story is clear.
A plain formula works well in a board pack:
ROI = (Cost avoided from fewer incidents and delays + Quality recovery − Programme cost) ÷ Programme cost
Keep your assumptions conservative and provide a sensitivity range so finance can see the downside and upside cases.
The most frequent distortion is checklist pressure, where teams rush to tick boxes. Counter this by rotating observers, spot-auditing submissions, and comparing observation rates across shifts. Another error is sampling bias from recording only incidents. Because incidents are rare, they make poor weekly guides. Balance them with frequent observations and camera samplin,g so leading indicators shape your actions.
Models drift when your layout or schedule changes. If you move a barrier or switch to split shifts, redraw zones, re-baseline thresholds, and run a short re-validation on recorded footage. Treat this as a routine maintenance task rather than a special project.
For a succinct overview of how detections translate into behaviour change in manufacturing, link to Invigilo’s Safety in Manufacturing through AI Technology.
Focus on four things.
First, accuracy in your lighting and occlusion conditions. Ask for a short validation on your recorded shifts and a simple report with precision, recall, and time to alert.
Second, latency and reliability under normal network load.
Third, integrations with your HR and access-control systems so shift and contractor dimensions are correct.
Fourth, practical support for zone calibration and retraining when layouts change.
Invigilo publishes a verified detection accuracy benchmark and offers manufacturing-specific detections. Confirm how that benchmark applies to your factory lighting or PPE combinations. If you require email alerts, particular streaming protocols such as RTSP, or deployment options beyond the default, contact Invigilo to confirm your choices.
Before you scale, freeze your metric dictionary, access policy, zone maps, and thresholds for the first month. Run a live drill to test each alert route and log response times. Deliver a short operator briefing and a supervisor checklist, and set up a weekly feedback loop for the first four weeks. If you need email alerts or configurable suppression windows, or you must validate protocol support such as RTSP or a specific VMS, contact Invigilo.
Ready to turn your factory’s day-to-day signals into auditable trend lines that actually change behaviour? Book a 30-minute manufacturing safety analytics consult with Invigilo. In one session, you will:
If any deployment detail in this article depends on your environment, reach out to Invigilo, and we will confirm it before you roll out.
To get analytics on safety compliance trends in factories, centralise the data you already have, define a small set of factory-specific leading indicators with clear formulas, and surface them in focused dashboards that drive weekly action. Layer in AI video analytics on existing cameras to quantify PPE adherence and unsafe proximity by shift and zone. Prove value with a four-week pilot that implements one targeted control change and shows a measurable improvement in the trend line. Keep governance tight so your ISO 45001 or OSHA evidence pack is a routine export, not a scramble. For deployment specifics such as alert channels, protocol support, hosting options, export templates, and validation methods, check Invigilo’s website or contact the team to confirm what fits your environment.
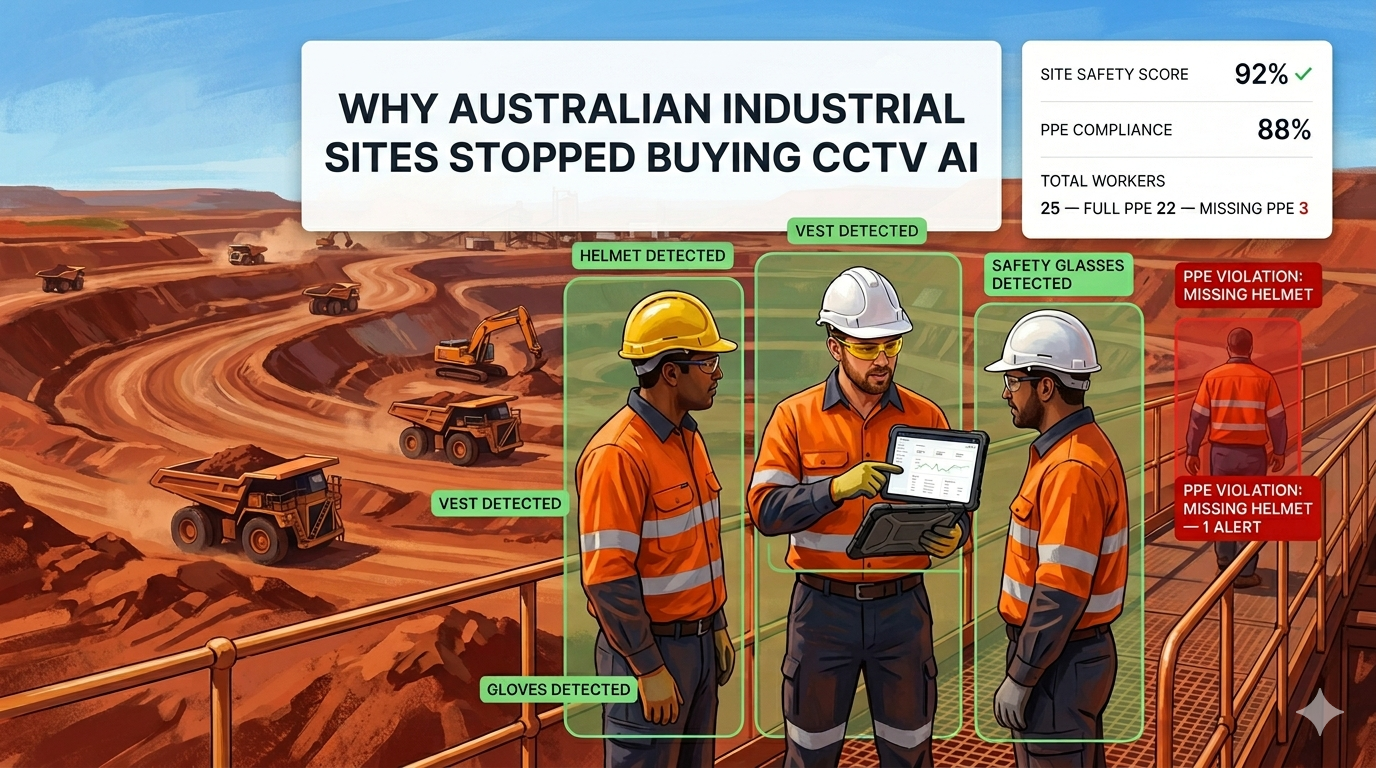
Australian HSE leaders aren't buying video analytics anymore- they're buying safety intelligence. Here's what the shift means for WHS in 2026.

AI safety platforms built for general workplaces are being sold into oil and gas operations across Saudi Arabia. Some perform. Many do not. These are the 8 questions that reveal the difference before you sign anything.
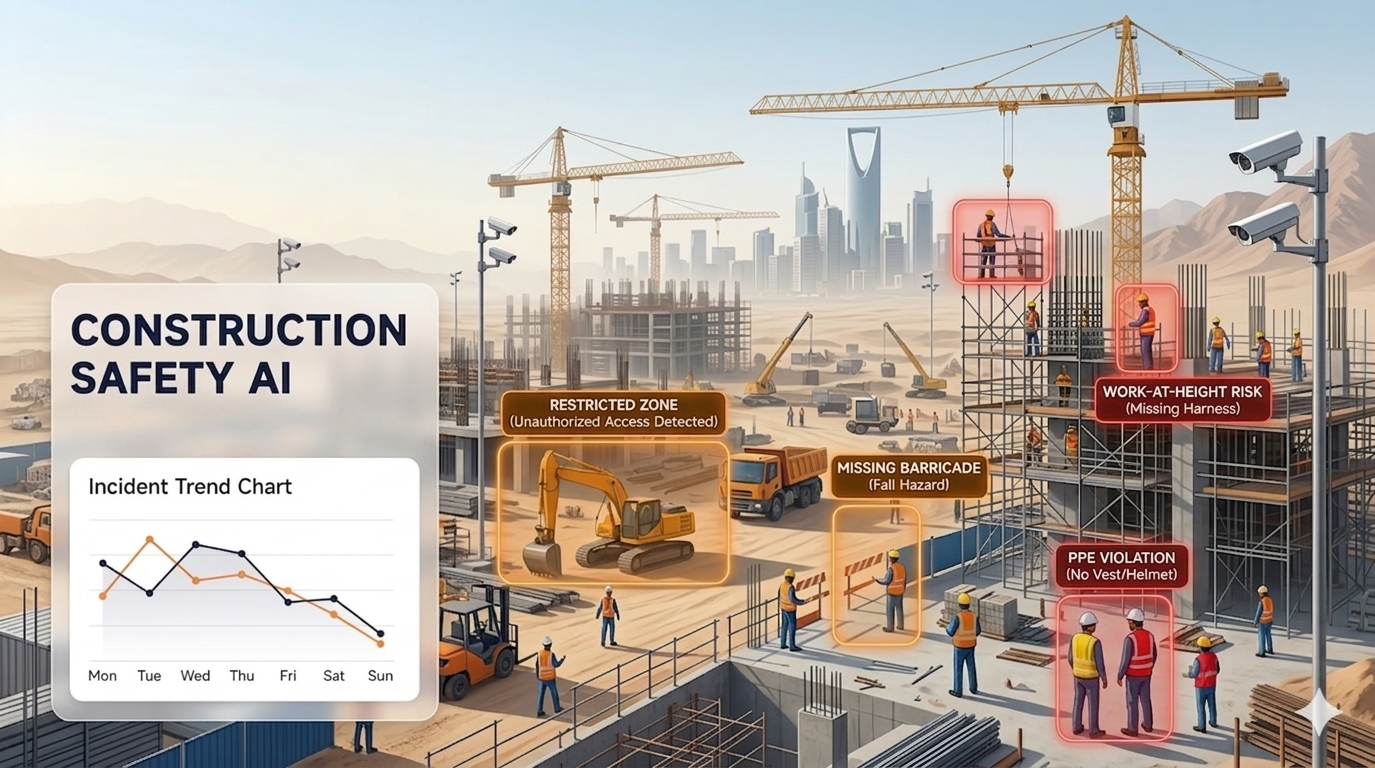
Construction safety AI helps Saudi HSE teams detect PPE violations, missing barricades, restricted zone entry, work-at-height risks, and unsafe activity in real time.
Ready to elevate safety in your operations? Let’s talk!
Contact us today for a personalized demo.

